 Awhile back I share about the scientific method and how it’s not as complicated as it seems. Step 5 of the scientific method says to “Record & Analyze any Observations and Results”.
In today’s Science Corner, I thought I would take some time to explain the difference between observations and results.
What are Observations?
Observations are a record of the things you see happening in your experiment.
What are Results?
Results are specific and measurable things that happen in your experiment.
A Sample Project
Let’s say that your students are doing a science fair project. They are trying to answer the question:
“Does the amount of light a plant get effect how quickly it grows?”
They have done their research and come up with a hypothesis that says:
The more light there is, the better the plant will grow.
Then, they developed an experiment to test that hypothesis.
In their experiment, they grew three pots of grass on a shelf in their room. Five days after the first growth appeared, they moved one of pots into a closet with no light, one of pots onto a window sill in full sun and left the last pot where it was.
Each day they wrote down a sentence on how the plant appeared and measured it’s growth.
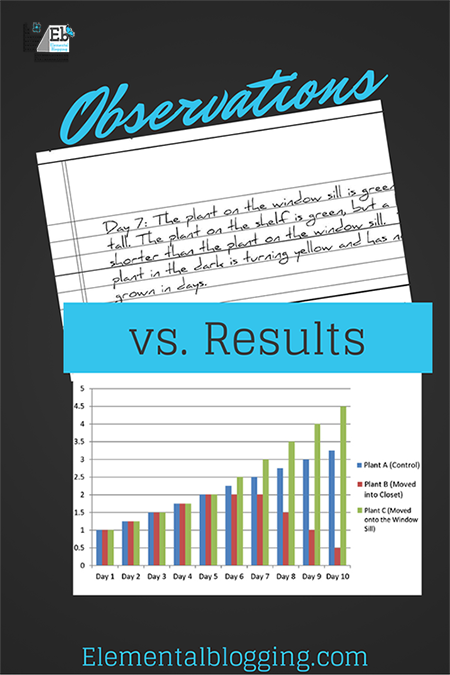
Their observations for the project would be recorded in journal form and look like this:
Day 7: The plant in the on the window sill is green and tall. The plant on the shelf is green, but a little shorter than the plant on the window sill. The plant in the dark is turning yellow and has not grown in days.
Their results for the project would be recorded in graph form and look like this:

The Final Product
In a nutshell, observations are generally recorded in journal form, while results can be compiled into tables, charts or graphs.
Knowing the difference between the two makes it much easier to analyze your data and come up with conclusion.
What about you, do you have any questions about observations or results? Leave a comment below and I’ll get back to you as soon as possible!


Hi Paige, What software do you start with in teaching your kids scientific graphing or tables for science projects and experiments like this?
I prefer to create graphs in Excel purely because it what I learned to use in college, so I’m familiar with it. They can create a table in Excel to enter the information into as they go along or enter the information afterwards. Then, it’s just a matter of highlighting the table and clicking the chart they want to use under the insert tab. Let me know if that doesn’t answer your question all the way :).